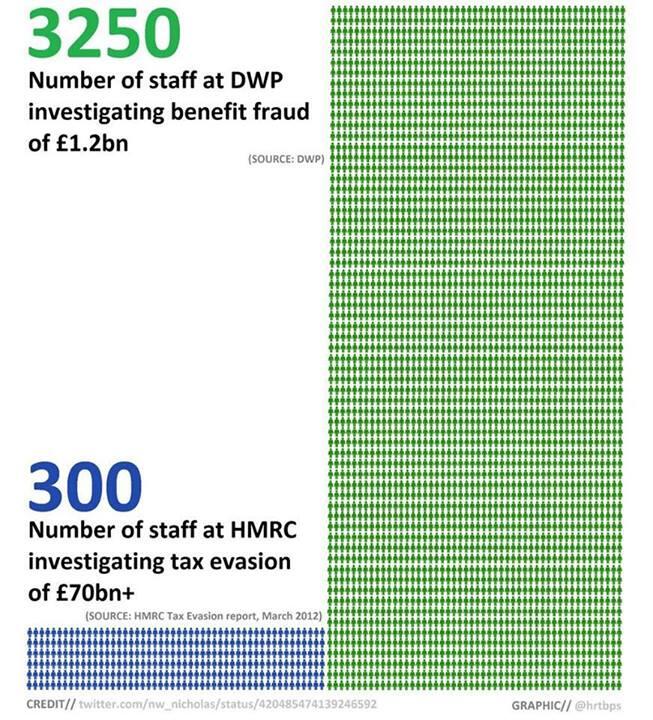
I was alerted, earlier this morning, via the medium of Facebook, to an interesting graphic.
Okay. Interesting stuff. But we know that many of these figures come from the Lord High Tax Denouncer himself, Richard
"Murray". Also known as "Richard Murphy". Not that famous campaign for justice for taxes, "
Murphy Richards".
But, look, they've given us a
source document. It doesn't say exactly what it is the source of but a rational observer would suggest that both the 300 staff and the £70bn+ figures should be found somewhere in there. Well, we know that the figure of £70bn+ "tax evasion" is utter bollocks - because Murphy gets royally and officially spanked for it. As well as having it
blogged about by "
the most under-rated business / economics journalist".
So lets look (and we can also get further information from the underlying source document to that source document, the HMRC "
Measuring tax gaps 2012" official statistics*.) Interestingly, the overall tax gap, there, is given as £32bn. As some of the tax gap is due to companies going bust owing money, for example, the tax evasion component needs to be less than the overall gap. So evasion isn't £70bn+ according to HMRC.
Anyway - that source document. Interestingly, it gives neither figure - not evasion nor the numbers employed. So it is a pretty crap source, really. It does say that, in combination with "criminal attack" and "the hidden economy", evasion makes up 46% of the £32bn tax gap. So, a maximum of £14.7bn. Going to the underlying source, this splits down in to £4bn for evasion and £5bn each for the other two (Ed notes:
I have no idea what happened to the not insignificant £700m - without it, that would reduce the combined %age to just under 44 rather than the quoted 46.)
Figures for HMRC staff are available from the HMRC
transparency datasets. Ignoring senior managers and using the March 2012 figures, this gives you 1495.74 FTEs in the "Specialist Investigations" department and 2231.94 in the "Criminal Investigation" department. Obviously, not all of these will be hard-core anti-tax evasion professionals - 3700 people don't self administer, certainly not in a government department but there are over ten times the claimed 300. And that is assuming that nobody else in HMRC has anything to do with tax evasion.
As for the DWP numbers, I've only checked the fraud figures and these, if not necessarily 'accurate' are the same as the
official statistics. However, they are missing things out (just as you'd expect.) Benefit errors, both over and underpaid, add up to £3.3bn. I would expect that, given the accuracy of the rest of the figures used for the graph, that these 3250 people include the ones who are hunting out all aspects of benefit mis-payment, not just the fraud. I would also point out that benefit fraud, objectively, would be at a lower value per event than tax fraud, therefore is going to require a larger number of people to track it down.
Overall, this is a stupidly misleading graph that even I, about as tax professional as our kitten, can refute in less time than it took me to type this. Far less, in fact - three google searches and the alteration of one URI.
* There is a later
2013 report available as well, covering tax year 2011-12.


